Sunday, April 19, 2015

R Tips - SQLDF, Lists

R is a wonderful language, and I hope more and more enthusiasts contribute to it. However like me, almost everybody is stuck with small irritating issues.

  • Joining/Filtering tables using SQLDF in R
SQLDF is a very powerful module. It brings the power of SQL to the already statistically powerful R

install.packages("sqldf")
library(sqldf)
crestValues = subset(testdata,Direction=='Crest')  

# Simple Select Query with SQLDF in R
out=sqldf("select Date,Close,JulianDate from crestValues order by JulianDate asc")

#  Inner Join  with SQLDF in R

finaltables11 = sqldf("select out2.lowJDate,out2.highJDate from tables11 inner join out2 where tables11.s2==out2.s2)

# Left Outer Join with SQLDF in R
tempt=sqldf("select t1.Close,max(t2.Close),t1.JulianDate as lowJDate,t2.JulianDate as highJDate from out t1 left outer join out t2 where t2.JulianDate > t1.JulianDate group by t1.Close")


# Fetch First Rows in a SQLDF R Query
tables11 = sqldf("select sum(highJDate-lowJDate),Count,s2 from tables2 group by Count,s2 limit 1")
  
  •   Accessing Data Frames using strings
There might be occassions where we have made a lot of data frames and we would like to access them based on user input/flow logic. Surprisingly this was a difficult task

Suppose we have 5 data frames created  
tables5 = sqldf("select count(s5) as Count,s5,lowJDate,highJDate from out2 group by s5 having count(s5) = 2 order by count(s5) desc")
  tables4 = sqldf("select count(s4) as Count,s4,lowJDate,highJDate from out2 group by s4 having count(s4) = 2 order by count(s4) desc")
  tables3 = sqldf("select count(s3) as Count,s3,lowJDate,highJDate from out2 group by s3 having count(s3) = 2 order by count(s3) desc")
  tables2 = sqldf("select count(s2) as Count,s2,lowJDate,highJDate from out2 group by s2 having count(s2) = 2 order by count(s2) desc")
  tables1 = sqldf("select count(s1) as Count,s1,lowJDate,highJDate from out2 group by s1 having count(s1) = 2 order by count(s1) desc")


Now I want to access each of the data frames in a for loop. The way I did it was

mylist = list(tables1,tables2,tables3,tables4,tables5)
for(k in 5:1)
  {
    remove(tables11,finaltables11)
    #tables11 = sqldf("select sum(highJDate-lowJDate),Count,s1 from tables1 group by Count,s1 limit 1")
    if(nrow(mylist[[k]])==0)
    {
      next;
    }

....
}

Thursday, April 16, 2015

ExoPlanet Analysis : Numerical to Categorical Data in R

After the recent discovery of a possible man made object by amateur outer space researchers, I thought that I should lay some hands on data from Outer space. I made use of the Exoplanet Orbit Database and the Exoplanet Data Explorer at exoplanets.org.

I used 2 variables Density and Gravity. We all know that more the density, more the gravity, so I just wanted to plot it. The problem was that both these columns were numerical values. This makes it difficult to plot. So i had to convert one of the variables to a category variable

I used the sapply function which proved to be very powerful


exoplanets$densityCategory = sapply(exoplanets$DENSITY,function(x) 
if(is.na(x)){'0'}
else if(x<2) {'less than 2'}
else if(x>=2) {'>2'})
We can always add more categories. So after this, it was a matter of plotting the data.

Sunday, April 5, 2015

Finding patterns in the Maxima/Minima Resistance/Support of Stock Prices

I have frequently seen people trying to find a pattern in the highs and lows of a stock. What they search for is a value that defines the upper limit and lower limit of the stock prices for the short term. This banding allows people to have an increased probability of profit making while taking position.This is usually denoted by a straight line drawn manually on the daily stock price chart. Like the one shown below


However this is easier done manually than automatically.

I plan to reproduce this with the help of an R code. I followed the following process

1) Mark all the "Crests" and "Troughs" on the graph
2) Find the "Crests" and "Troughs" with the maximum similar reflection points
3) These undoubtedly become your resistance/support plots
4) However, we need to find out when the resistance/support has changed ( this usually happens due to any micro/macro factor ). But this is the most difficult part
5) We need to find an algorithm for doing this
6) Also the resistance/support lines in many stocks might not be a zero slope line. They might have some gradient. It is difficult to identify them

The above is the plot of AAPL ( Apple Inc ) on NASDAQ. I have been able to Crests/Troughs but it seems the resistance line is going to have a slope. I need to factor this into my code too

After factoring in the slopes for finding the support plots/trends there was significant improvements in the plots. The code can be found here . However the input data required for this consists of daily stock prices. This can be found as a separate R script here
You need to replace the system file paths in the scripts

Some sample graphs from this code are


Some more refinement is required. Any comments or reviews are welcome

Saturday, March 28, 2015

Can we predict Financial Crisis : Equity Correlation

Can we predict any financial crisis? Can we take a look at the stocks at any moment and say whether the market is moving towards another booom. Everybody wants to have such an analysis in their bag.
This will not only help an organization avoid market losses but use that information to their advantage

A financial crisis is preceded by a financial bubble, where speculation reaches its maximum. In other words the stocks become highly correlated. So it does not matter where you are investing. Every stock would have a positive return

1) Multiple Correlation Coefficient
This is the basis of my analysis. On a particular exchange, If i observe the correlation statistics of all stocks and can prove that the correlation is converging then we can raise the flag. However with hundreds of stocks it is difficult to analyse the correlation matrix. So we have to come up with a singular number. So i used the Multiple Correlation Coefficient. You can reach more about it at http://en.wikipedia.org/wiki/Multiple_correlation

Let us assume that we have 100 stock prices. We can make the first stock price as the dependent variable and the rest of the 99 stocks as the independent.
We then calculate the correlation matrix for the 99 stocks which gives as the below matrix R


We then calculate the matrix C which is the correlation between the dependent stock and each of the 99 independent stocks

The Multiple Correlation Coefficient is now simply


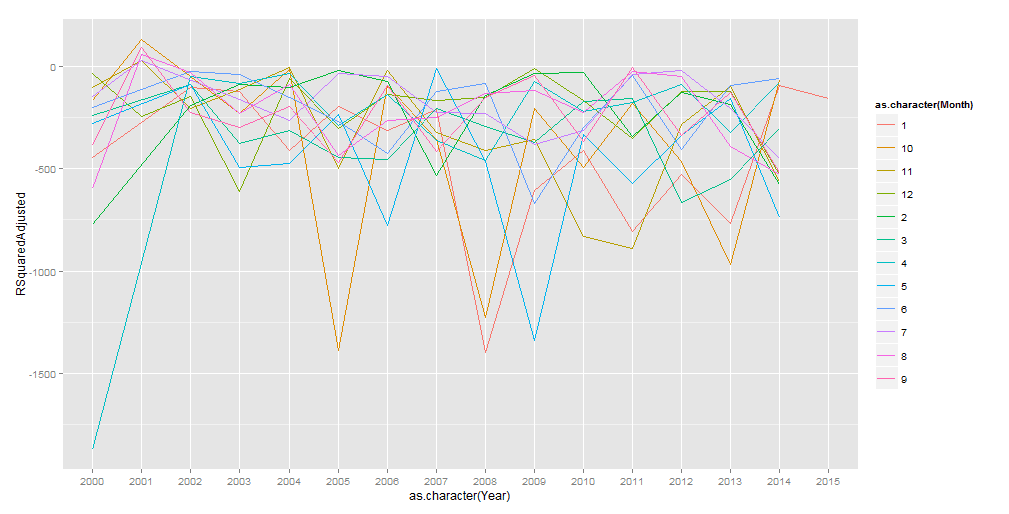
I took BSE(Bombay Stock Exchange) as my initial sample space. I have two graphs


 The values plotted are for the Adjusted Correlation Coefficient from 2000 to 2010

 The values plotted are for the Adjusted Correlation Coefficient from 2000 to 2014

However, the above method can be assumed to be brute force. We would like to intelligibly select the independent variables. I plan to use PCA and Cholesky for further analysis and compare the data

2) Principal Component Analysis


3) Cholesky Transformation

Sunday, March 22, 2015

Historical Finance News Feed

I scraped some financial news data for the year 2015. The file is present here. I am scraping data for the past 15 20 years for all subject lines ( Commodities, FX, Bonds etc )

Scraping the data is not enough. We would like to link the news to some effect on the stock prices so that we can use it for prediction/forecasting.

ANALYSIS 1
I took the stock prices and found the variation between the High and Opening Prices. Any day with a movement of more than 4 SD's can be marked as potential news days. We will then take the news from these days and mark them as having POSITIVE Sentiment on the Stock

Code
# Accessing the news feed content in R
library(XML)
library(RCurl)
# Find the big deviations and find if there are related news and vice versa

# We will read data from the master source file of RICS
Tickers = read.csv('C:\\Anant\\MyLearning\\Statistics\\SpreadAnalysis\\WorldTickerList.csv')

# For now we will take the example of GOOGLE in that list
Tickers = Tickers[Tickers$TICKER=='GOOG',]

# We will use the Ticker value and download data from Yahoo Finance
# You can also customise the date ranges
URL = paste(c('http://real-chart.finance.yahoo.com/table.csv?s=',as.character(Tickers$TICKER),'&a=00&b=01&c=2015&d=08&e=30&f=2015&g=d&ignore=.csv'),collapse="")
GOOG = read.csv(URL)

GOOG$OpenHighSpread = GOOG$High - GOOG$Open
GOOG$LowHighSpread = GOOG$High - GOOG$Low
GOOG$OpenHigh = (GOOG$OpenHighSpread - mean(GOOG$OpenHighSpread))/sd(GOOG$OpenHighSpread)
GOOG$LowHigh = (GOOG$LowHighSpread - mean(GOOG$LowHighSpread))/sd(GOOG$LowHighSpread)

MajorPoints = GOOG[GOOG$OpenHigh < -3 | GOOG$OpenHigh > 3,]

# We see that there were 4 dates when there was a lot of deviation in the Open High
# There must have been some news around these dates

#############################################################################################
# Source 1 : GOOGLE

#############################################################################################
# source 2 Reuters
for(dateValue in MajorPoints$Date)
{
  newsDateURL = paste(c('http://www.reuters.com/finance/stocks/companyNews?symbol=GOOG.O&date=',format(as.Date(dateValue,"%Y-%m-%d"),"%m%d%Y")),collapse="")
  #newsDateURL = paste(c(newsURL,'&startdate=',dateValue,'&enddate=',dateValue),collapse="")
  print(newsDateURL)
  doc = getURL(newsDateURL)
  doc = htmlParse(doc)
  news = xpathSApply(doc,'//div[@id = "companyNews"]/div/div/div/p')
}

#############################################################################################
# Source 3 Google
for(dateValue in MajorPoints$Date)
{
  newsDateURL = paste(c('http://finance.yahoo.com/q/h?s=',as.character(Tickers$TICKER),'&t',as.character(dateValue)),collapse="")
  #newsDateURL = paste(c(newsURL,'&startdate=',dateValue,'&enddate=',dateValue),collapse="")
  print(newsDateURL)
  doc = getURL(newsDateURL)
  doc = htmlParse(doc)
  news = xpathSApply(doc,'//div[@class = "mod yfi_quote_headline withsky"]/ul/li//a')
}


Next step is to do some Language Processing on this data

Historical Finance News Feed

I scraped some financial news data for the year 2015. The file is present here. I am scraping data for the past 15 20 years for all subject lines ( Commodities, FX, Bonds etc )

Scraping the data is not enough. We would like to link the news to some effect on the stock prices so that we can use it for prediction/forecasting.

ANALYSIS 1
I took the stock prices and found the variation between the High and Opening Prices. Any day with a movement of more than 4 SD's can be marked as potential news days. We will then take the news from these days and mark them as having POSITIVE Sentiment on the Stock

Code
# Accessing the news feed content in R
library(XML)
library(RCurl)
# Find the big deviations and find if there are related news and vice versa

# We will read data from the master source file of RICS
Tickers = read.csv('C:\\Anant\\MyLearning\\Statistics\\SpreadAnalysis\\WorldTickerList.csv')

# For now we will take the example of GOOGLE in that list
Tickers = Tickers[Tickers$TICKER=='GOOG',]

# We will use the Ticker value and download data from Yahoo Finance
# You can also customise the date ranges
URL = paste(c('http://real-chart.finance.yahoo.com/table.csv?s=',as.character(Tickers$TICKER),'&a=00&b=01&c=2015&d=08&e=30&f=2015&g=d&ignore=.csv'),collapse="")
GOOG = read.csv(URL)

GOOG$OpenHighSpread = GOOG$High - GOOG$Open
GOOG$LowHighSpread = GOOG$High - GOOG$Low
GOOG$OpenHigh = (GOOG$OpenHighSpread - mean(GOOG$OpenHighSpread))/sd(GOOG$OpenHighSpread)
GOOG$LowHigh = (GOOG$LowHighSpread - mean(GOOG$LowHighSpread))/sd(GOOG$LowHighSpread)

MajorPoints = GOOG[GOOG$OpenHigh < -3 | GOOG$OpenHigh > 3,]

# We see that there were 4 dates when there was a lot of deviation in the Open High
# There must have been some news around these dates

#############################################################################################
# Source 1 : GOOGLE

#############################################################################################
# source 2 Reuters
for(dateValue in MajorPoints$Date)
{
  newsDateURL = paste(c('http://www.reuters.com/finance/stocks/companyNews?symbol=GOOG.O&date=',format(as.Date(dateValue,"%Y-%m-%d"),"%m%d%Y")),collapse="")
  #newsDateURL = paste(c(newsURL,'&startdate=',dateValue,'&enddate=',dateValue),collapse="")
  print(newsDateURL)
  doc = getURL(newsDateURL)
  doc = htmlParse(doc)
  news = xpathSApply(doc,'//div[@id = "companyNews"]/div/div/div/p')
}

#############################################################################################
# Source 3 Google
for(dateValue in MajorPoints$Date)
{
  newsDateURL = paste(c('http://finance.yahoo.com/q/h?s=',as.character(Tickers$TICKER),'&t',as.character(dateValue)),collapse="")
  #newsDateURL = paste(c(newsURL,'&startdate=',dateValue,'&enddate=',dateValue),collapse="")
  print(newsDateURL)
  doc = getURL(newsDateURL)
  doc = htmlParse(doc)
  news = xpathSApply(doc,'//div[@class = "mod yfi_quote_headline withsky"]/ul/li//a')
}


Next step is to do some Language Processing on this data

Thursday, March 19, 2015

Finding monthly Patterns in Stocks

There are some stocks that perform well at a certain time of the year due to the nature of the business. I tried to isolate those stocks. I took BSE as my base and got data for the past 12 years

The graph below is for VOLTAS.BO ( Sum of Returns for the entire month vs Month ) across 12 years

The code for obtaining the above graph can be found here

I then took other exchanges around the world to find patterns in stock prices. I calculated the standard deviation of the monthly returns for each month across the years. The stocks with the lowest standard deviations were the ones which saw equal increase or decrease in returns during that month across years. The code for doing it can be found here

Within the code you can replace the line
dataFile <- br="" nant="" orldtickerlist.csv="" read.csv="" tatistics="" tockdata="" ylearning="">
with your own ticker list. I have a reference to the world ticker list present in my earlier blog post
http://simplyanant.blogspot.in/2015/03/download-all-tickers-for.html

 For BSE I got the following results. You can use the commented ggplot command in the code to plot the graph and see for yourself. There will be a month where the returns follow a pattern
[1] "TURBO.BO"
[1] "KEDIAVA.BO"
[1] "JRIIIL.BO"
[1] "JPPOWER4.BO"
[1] "JOLLYRID.BO"
[1] "JUMBFNL.BO"
[1] "TURBO.BO"
[1] "KEDIAVA.BO"
[1] "JAGSONFI.BO"
[1] "JRIIIL.BO"
[1] "JPPOWER4.BO"
[1] "JOLLYRID.BO"
[1] "JUMBFNL.BO"
[1] "RAJOIL.BO"

Best of luck hunting stock patterns :) Any suggestions are welcome

Obviously the following will give you a hint :)