Showing posts with label R Financial Analysis. Show all posts

Sunday, September 27, 2015

Bollinger Bands using R

Bollinger Plots are a very good way of providing technical information on plausible Buy or Sell on a particular security. They are based on moving averages and thus are simple to create

However, there are 2 parameters that are inputs to the Bollinger Band
1) The period of days considered for calculating the moving average
Most of the analysts use a 20 day plot, but you can use any period based on the security. e.g. A highly liquid security with high volatility should have a lower period.

The R script can be downloaded here
# Bollinger Bands
Ticker = 'AAPL'
URL = paste(c('http://real-chart.finance.yahoo.com/table.csv?s=',Ticker,'&a=01&b=01&c=2015&d=04&e=10&f=2015&g=d&ignore=.csv'),collapse="")
Prices = read.csv(URL)
Prices = Prices[,c(1,5)]
# Simple moving average of a vector of price and the number of days
getMovingAverage = function(dataVector,periodDays,method){
  dataVectorOutput = dataVector
  lengthofVector = length(dataVector)
  for(start in 1:lengthofVector)
  {
    if(start < periodDays)
    {
      dataVectorOutput[start] = NA
    }
    else
    {
      if(method=="mean")  dataVectorOutput[start] = mean(dataVector[start-periodDays:start])
      else if(method=="sd") dataVectorOutput[start] = sd(dataVector[start-periodDays:start])
    }  
  }
  return(dataVectorOutput)
}

dataVectorOutputMean = getMovingAverage(Prices$Close,20,"mean")
dataVectorOutputSD = getMovingAverage(Prices$Close,20,"sd")
Prices$Middle = dataVectorOutputMean
Prices$Upper = dataVectorOutputMean + dataVectorOutputSD * 2
Prices$Lower = dataVectorOutputMean - dataVectorOutputSD * 2

#Remove all the NULLS
Prices = Prices[!is.na(Prices$Middle),]

# Change the date to something that ggplot will understand
Prices$Date = as.POSIXct(as.character(Prices$Date),"%Y-%m-%d")

# Plot the Bollinger
library(ggplot2)
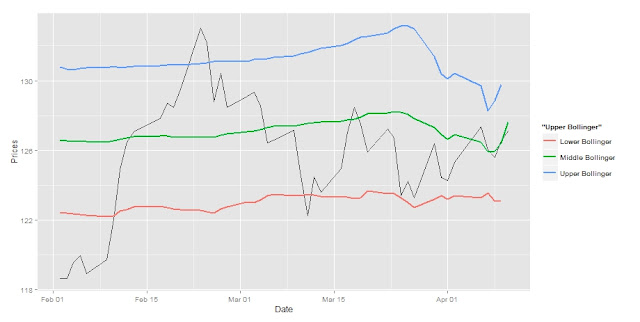
g = ggplot(Prices,aes(Date,Close,group=1)) + geom_line()
g = g + geom_line(data=Prices,aes(Date,Upper,group="Upper Bollinger",color="Upper Bollinger"),size=1)
g = g + geom_line(data=Prices,aes(Date,Middle,group="Middle Bollinger",color="Middle Bollinger"),size=1)
g = g + geom_line(data=Prices,aes(Date,Lower,group="Lower Bollinger",color="Lower Bollinger"),size=1)
g = g + xlab("Date") + ylab("Prices")
g


A Sample plot for the AAPL Stock was created using the above script

Sunday, March 22, 2015

Historical Finance News Feed

I scraped some financial news data for the year 2015. The file is present here. I am scraping data for the past 15 20 years for all subject lines ( Commodities, FX, Bonds etc )

Scraping the data is not enough. We would like to link the news to some effect on the stock prices so that we can use it for prediction/forecasting.

ANALYSIS 1
I took the stock prices and found the variation between the High and Opening Prices. Any day with a movement of more than 4 SD's can be marked as potential news days. We will then take the news from these days and mark them as having POSITIVE Sentiment on the Stock

Code
# Accessing the news feed content in R
library(XML)
library(RCurl)
# Find the big deviations and find if there are related news and vice versa

# We will read data from the master source file of RICS
Tickers = read.csv('C:\\Anant\\MyLearning\\Statistics\\SpreadAnalysis\\WorldTickerList.csv')

# For now we will take the example of GOOGLE in that list
Tickers = Tickers[Tickers$TICKER=='GOOG',]

# We will use the Ticker value and download data from Yahoo Finance
# You can also customise the date ranges
URL = paste(c('http://real-chart.finance.yahoo.com/table.csv?s=',as.character(Tickers$TICKER),'&a=00&b=01&c=2015&d=08&e=30&f=2015&g=d&ignore=.csv'),collapse="")
GOOG = read.csv(URL)

GOOG$OpenHighSpread = GOOG$High - GOOG$Open
GOOG$LowHighSpread = GOOG$High - GOOG$Low
GOOG$OpenHigh = (GOOG$OpenHighSpread - mean(GOOG$OpenHighSpread))/sd(GOOG$OpenHighSpread)
GOOG$LowHigh = (GOOG$LowHighSpread - mean(GOOG$LowHighSpread))/sd(GOOG$LowHighSpread)

MajorPoints = GOOG[GOOG$OpenHigh < -3 | GOOG$OpenHigh > 3,]

# We see that there were 4 dates when there was a lot of deviation in the Open High
# There must have been some news around these dates

#############################################################################################
# Source 1 : GOOGLE

#############################################################################################
# source 2 Reuters
for(dateValue in MajorPoints$Date)
{
  newsDateURL = paste(c('http://www.reuters.com/finance/stocks/companyNews?symbol=GOOG.O&date=',format(as.Date(dateValue,"%Y-%m-%d"),"%m%d%Y")),collapse="")
  #newsDateURL = paste(c(newsURL,'&startdate=',dateValue,'&enddate=',dateValue),collapse="")
  print(newsDateURL)
  doc = getURL(newsDateURL)
  doc = htmlParse(doc)
  news = xpathSApply(doc,'//div[@id = "companyNews"]/div/div/div/p')
}

#############################################################################################
# Source 3 Google
for(dateValue in MajorPoints$Date)
{
  newsDateURL = paste(c('http://finance.yahoo.com/q/h?s=',as.character(Tickers$TICKER),'&t',as.character(dateValue)),collapse="")
  #newsDateURL = paste(c(newsURL,'&startdate=',dateValue,'&enddate=',dateValue),collapse="")
  print(newsDateURL)
  doc = getURL(newsDateURL)
  doc = htmlParse(doc)
  news = xpathSApply(doc,'//div[@class = "mod yfi_quote_headline withsky"]/ul/li//a')
}


Next step is to do some Language Processing on this data