Thursday, March 19, 2015

Finding monthly Patterns in Stocks

There are some stocks that perform well at a certain time of the year due to the nature of the business. I tried to isolate those stocks. I took BSE as my base and got data for the past 12 years

The graph below is for VOLTAS.BO ( Sum of Returns for the entire month vs Month ) across 12 years

The code for obtaining the above graph can be found here

I then took other exchanges around the world to find patterns in stock prices. I calculated the standard deviation of the monthly returns for each month across the years. The stocks with the lowest standard deviations were the ones which saw equal increase or decrease in returns during that month across years. The code for doing it can be found here

Within the code you can replace the line
dataFile <- br="" nant="" orldtickerlist.csv="" read.csv="" tatistics="" tockdata="" ylearning="">
with your own ticker list. I have a reference to the world ticker list present in my earlier blog post
http://simplyanant.blogspot.in/2015/03/download-all-tickers-for.html

 For BSE I got the following results. You can use the commented ggplot command in the code to plot the graph and see for yourself. There will be a month where the returns follow a pattern
[1] "TURBO.BO"
[1] "KEDIAVA.BO"
[1] "JRIIIL.BO"
[1] "JPPOWER4.BO"
[1] "JOLLYRID.BO"
[1] "JUMBFNL.BO"
[1] "TURBO.BO"
[1] "KEDIAVA.BO"
[1] "JAGSONFI.BO"
[1] "JRIIIL.BO"
[1] "JPPOWER4.BO"
[1] "JOLLYRID.BO"
[1] "JUMBFNL.BO"
[1] "RAJOIL.BO"

Best of luck hunting stock patterns :) Any suggestions are welcome

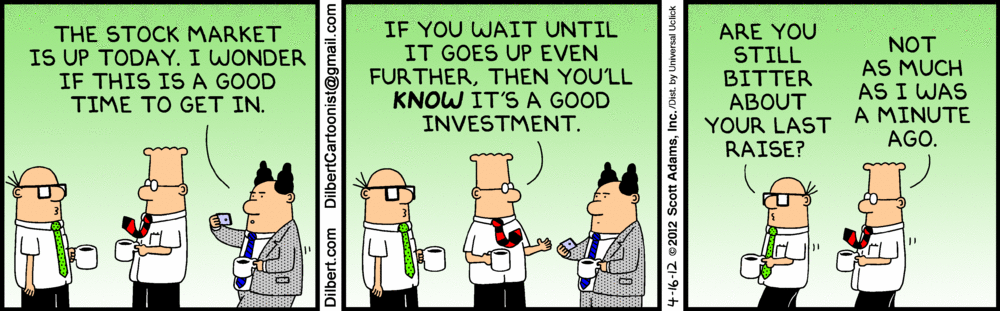
Obviously the following will give you a hint :)


Tuesday, March 17, 2015

Mumbai Weather Analysis

After staying in mumbai for the past 4.5 years, I have come to the conclusion that the weather is not quite what I had expected. I had expected a moderate one with lots of wind, but sadly that is not the case. It might be because of the high rise construction or the traffic, but who knows

I collected data available for a mumbai weather station. The data is available in form of an excel sheet here

Let us start with max temperature

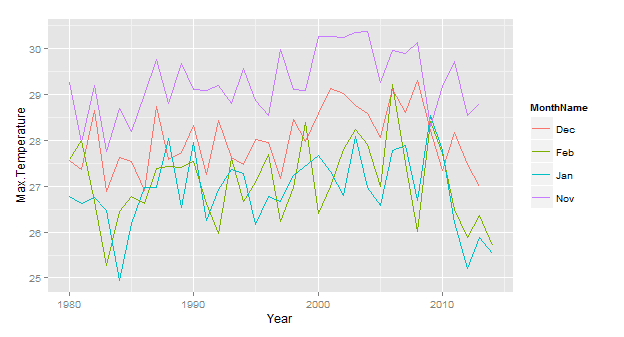
In the summer season, the max temperature has actually decreased from 2010 onwards. It rose to its maximum in the month of May

We can see that the month of November considered everywhere else as a winter month is not so, for the month of November

October sees a sharp rise in temperature as the monsoon recedes


Let us come now to Minimum temperatures

Surprisingly, there is a huge shift between the temperatures of March and April ( the onset of summer )
Rain keeps the climate moderate with less differences between the max and min temperatures which can be seen here

There is again a huge difference between the min temperature for the month of Nov and that of Dec

Monday, March 9, 2015

Download all tickers for Stocks,ETF,Mutual Fund etc from all over the world

Sadly there is no easy way to download all the ticker information. The only way I could do it is to parse the Yahoo finance web pages and parse them

Dowload the file 

The above file has the timestamp of 15th March. I used PErl to scrape the web pages. If somebody wants the Perl code to obtain this information, just let me know. It is pretty simple, although it will take 5 to 6 hours

Sunday, March 8, 2015

Pulling Stock Data through R/YQL

After i got the list of all tickers of products around the world, I started pulling data and doing some analysis. The easiest of the analysis were
1) Finding the spread
2) Finding the correlated products

I chose stocks from 2 countries
a) BSE Stocks from India
b) German Stocks from the DE Bourse
c) Currency data all over the world

Here are a few interesting points
From the analysis from the year 2013 onwards, the currencies CAD and GTQ had the highest negative correlation. In order to verify it, I pulled data from the website and it matches

On the flip side, the highly correlated currencies were DKK and XAF


One more observation is that most of the OPEC countries have their currency highly correlated to the dollar trying to find a correlation between them and other currencies s similar to finding correlations between USD and other currencies

The R script which i used to find out these is located here and here. The first file is to calculate the spread/deviation and the second is to download the data. The scripts are pretty simple, one needs to change the directories though for their use

If you want to use excel to extract the stock information, then the best method would be YQL .It is easy to use and you have all sorts of information in  a structured format

If you want to pull out historical prices with the following specifciations
Symbol/Ticker : symbol
StartDate
EndDate

then the correpsonding weblink to extract this info would be ( the below is in excel vba format )
"http://query.yahooapis.com/v1/public/yql?q=select%20*%20from%20yahoo.finance.historicaldata%20where%20symbol%20in%20%28%27 " & symbol & "%27%29%20and%20startDate%20=%20%27" & startDate & "%27%20and%20endDate%20=%20%27" & endDate & "%27&diagnostics=true&env=store://datatables.org/alltableswithkeys"

I have created an excel sheet where you can give a list of the stock tickers and the start and end date and it will download the neccessary information within the excel sheet

You can download the sheet here and tweak it as per your requirements. Enjoy

Wednesday, February 25, 2015

Cutting of Trees at Aarey Milk Colony, Mumbai

The recent decision by MMRDA to cut down 3000 trees in the Aarey Colony is a bad one. It seems they have little idea of the importance of the aarey forest land around Mumbai

With a population of 20000000 Mumbai emits around 3 crore tons of carbon per year. Most of it is thrown into the atmosphere. A large part is sequestered by the Sanjay Gandhi National Park. However it is one trees work at a time.

Due to the 3000 trees being cut , 52 tons of carbon will be emitted into the atmosphere. And on an annual basis a 100 tons of carbon which would have been sequestered will now remain in the atmoshphere


Monday, January 12, 2015

Movie Stats .. Bollywood

Hi, I have been recently thinking of an area to analyse and after watching some bad movies, I decided to give a go for bollywood movies. Can we crunch it through numbers/stats to fin out whether the movie will do good or bad ( irrespective of what the movie is about). This project is comprehensive and it will take time to collect data, so i will go slowly

I took the 2001-2010 decade and tried to analyse the move gross by months. We see that that the month of Dec did not hold a lot of promise. It was obviously pre-Aamir Khan era. From 2007 there has been a surge in the gross collected in the month of December. A jump of almost 150% to 100 crore rupees


In the above images we can see a lot of shifts

1) Increase in movie gross Revenue ( in crores )

2) Change in the monthly Gross Revenue ( in crores )

It can be easily seen that purely on the basis of Month, we will not be able to ascertain the earnings. E.g. In the era 2002 to 2009, there were few months that would steal away most of the revenues. In 2007-2008 alone Aug, Oct and Dec stole away 50% of the yearly gross. In 2013 the top 3 months have taken away 38% of the revenue. The figure was even less in the years 2012 and 2011. Movies have begun to spread out evenly and there are more opportunities for newcomers and new genres

On running a simple linear regression between the
a) Earnings of Dec : Dependant Variable
b) Earnings of Aug, Sep, Oct, Nov : Independant Variables


  Coefficients
Intercept 11.28481646
Aug 0.281777793
Sep 0.280503546
Oct -0.094513125
Nov -0.419597559

It is inversely related to the month of November ( highly inverse )

There are more factors at play
1) Director/Producer
2) Actor
3) Festival
4) etc.. etc

I will be taking all of these into consideration in my next article. Please let me know if you have some other suggestions/ideas

Thursday, January 8, 2015

Pulling Company Information through R


For some time now, I was grappling  with getting company fundamental ratios to be able to do analysis. I have written a small R script that downloads the necessary market data for that stock ( in the example AAPL ). The source of the data is YAHOO Finance

After execution the R workspace will contain 2 data frames
ratios    -> Quantitative Data
ratios2  -> Qualitative Data

Download File


I am working on getting more balance sheet related information. It is always better to have more information while doing analysis

If anybody wants to have the complete list of companies enlisted in NSE, you can get it here Download File

After searching around for some time, I wrote a script that will scrape and list the tickers etc for products around the world. The current list contains of 110,000 products. You can download the Excel file here Download File Timestamp : 2nd March,2015 ( I refrained from using csv, because the company name consisted of all sorts of characters which can meddle with string separation :) )