Monday, September 28, 2015

Implied Volatility in R ( Newton Raphson )

Just how fast is Newton Raphson method. We will not be able to understand the power unless we compare it with other methods
I am trying to find the Implied Volatility of an option using 2 methods

1) BISECTION METHOD

This involves providing a limit for the variable in question and adjusting the lower and higher limit based on the output of the current iteration

We have an ordinary Black Scholes equation
BS = function(S, K, T, r, sig, type="C"){
  d1 = (log(S/K) + (r + sig^2/2)*T) / (sig*sqrt(T))
  d2 = d1 - sig*sqrt(T)
  if(type=="C"){
    value = S*pnorm(d1) - K*exp(-r*T)*pnorm(d2)
  }
  if(type=="P"){
    value = K*exp(-r*T)*pnorm(-d2) - S*pnorm(-d1)
  }
  return(value)
}

The Bisection method will try to reduce the err term in the code below
err  = BS(S,K,T,r,sig,type) - market

The function implied.vol will take these inputs and minimise the err term upto 1000 iterations
implied.vol =
  function(S, K, T, r, market, type){
    sig = 0.20
    sig.up = 1
    sig.down = 0.001
    count = 0
    err = BS(S, K, T, r, sig, type) - market 
    
    ## repeat until error is sufficiently small or counter hits 1000
    while(abs(err) > 0.00001 && count<1000 div="">
      if(err < 0){
        sig.down = sig
        sig = (sig.up + sig)/2
      }else{
        sig.up = sig
        sig = (sig.down + sig)/2
      }
      err = BS(S, K, T, r, sig, type) - market
      count = count + 1
    }
    print(c("Counter is ",count),sep='')
    ## return NA if counter hit 1000
    if(count==1000){
      return(NA)
    }else{
      return(sig)
    }
  }

I clocked the execution and took the following AAPL option
Oct 2 Expiry as on 28th September with a Strike Price of 110

startTime = Sys.time()
implied.vol(112.44,110.00,4/252,.0031,3.50,"C")
print(Sys.time() - startTime)

0.02500105 secs 17 iterations

2) NEWTON RAPHSON

Newton-Raphson method (univariate)


We will recalculate the option price using Newton Raphson

NR = function(f,tolerance=.0000001,start=1,iteration=100)
{
  deltax=.0000001
  counter=1
  current=start
  arrayofSolutions=numeric(iteration)
  while(counter <=iteration)
  {
    df.dx=(f(start+deltax) -f(start))/deltax
    current=start - (f(start)/df.dx)
    #print(current)
    arrayofSolutions[counter]=current
    counter = counter + 1
    if(abs(current-start) < tolerance) break
    start=current
  }
  return(arrayofSolutions[1:counter-1])
}

BSVolatility = function(volatility)
{
  BS(112.44,110.00,4/252,.0031,volatility,"C") - 3.5
}

I clocked the timings
startTime = Sys.time()
NR(BSVolatility,.000001,1,100)
print(Sys.time() - startTime)

0.01400089 sec 4 iterations
Sunday, September 27, 2015

Bollinger Bands using R

Bollinger Plots are a very good way of providing technical information on plausible Buy or Sell on a particular security. They are based on moving averages and thus are simple to create

However, there are 2 parameters that are inputs to the Bollinger Band
1) The period of days considered for calculating the moving average
Most of the analysts use a 20 day plot, but you can use any period based on the security. e.g. A highly liquid security with high volatility should have a lower period.

The R script can be downloaded here

# Bollinger Bands
Ticker = 'AAPL'
URL = paste(c('http://real-chart.finance.yahoo.com/table.csv?s=',Ticker,'&a=01&b=01&c=2015&d=04&e=10&f=2015&g=d&ignore=.csv'),collapse="")
Prices = read.csv(URL)
Prices = Prices[,c(1,5)]
# Simple moving average of a vector of price and the number of days
getMovingAverage = function(dataVector,periodDays,method){
  dataVectorOutput = dataVector
  lengthofVector = length(dataVector)
  for(start in 1:lengthofVector)
  {
    if(start < periodDays)
    {
      dataVectorOutput[start] = NA
    }
    else
    {
      if(method=="mean")  dataVectorOutput[start] = mean(dataVector[start-periodDays:start])
      else if(method=="sd") dataVectorOutput[start] = sd(dataVector[start-periodDays:start])
    }  
  }
  return(dataVectorOutput)
}

dataVectorOutputMean = getMovingAverage(Prices$Close,20,"mean")
dataVectorOutputSD = getMovingAverage(Prices$Close,20,"sd")
Prices$Middle = dataVectorOutputMean
Prices$Upper = dataVectorOutputMean + dataVectorOutputSD * 2
Prices$Lower = dataVectorOutputMean - dataVectorOutputSD * 2

#Remove all the NULLS
Prices = Prices[!is.na(Prices$Middle),]

# Change the date to something that ggplot will understand
Prices$Date = as.POSIXct(as.character(Prices$Date),"%Y-%m-%d")

# Plot the Bollinger
library(ggplot2)
g = ggplot(Prices,aes(Date,Close,group=1)) + geom_line()
g = g + geom_line(data=Prices,aes(Date,Upper,group="Upper Bollinger",color="Upper Bollinger"),size=1)
g = g + geom_line(data=Prices,aes(Date,Middle,group="Middle Bollinger",color="Middle Bollinger"),size=1)
g = g + geom_line(data=Prices,aes(Date,Lower,group="Lower Bollinger",color="Lower Bollinger"),size=1)
g = g + xlab("Date") + ylab("Prices")
g


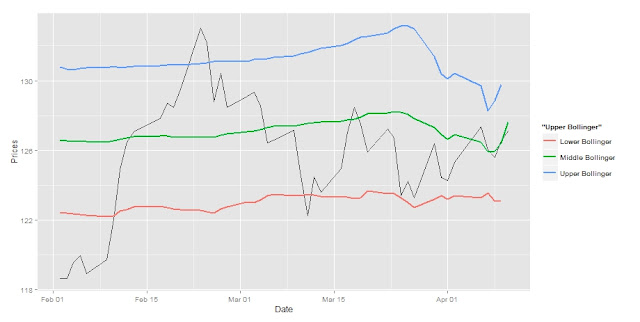
A Sample plot for the AAPL Stock was created using the above script

Sunday, September 20, 2015

Curve Fitting

It is wonderful to see how so many things that we learn individually in our mathematics class come together to solve one problem statement

Lets say we have the density of returns of a particular stock. I want to know the mathematical formula that would simulate the graph

In the graph shown above, we have the returns for  AAPL. Now I tried using the Generalized Hyperbolic distribution and fitted it using Maximum Likelihood Estimation. It has done a pretty good job but we want to be more accurate. We will see what else we can do to make it more accurate