Monday, September 28, 2015

Implied Volatility in R ( Newton Raphson )

Just how fast is Newton Raphson method. We will not be able to understand the power unless we compare it with other methods
I am trying to find the Implied Volatility of an option using 2 methods

1) BISECTION METHOD

This involves providing a limit for the variable in question and adjusting the lower and higher limit based on the output of the current iteration

We have an ordinary Black Scholes equation
BS = function(S, K, T, r, sig, type="C"){
  d1 = (log(S/K) + (r + sig^2/2)*T) / (sig*sqrt(T))
  d2 = d1 - sig*sqrt(T)
  if(type=="C"){
    value = S*pnorm(d1) - K*exp(-r*T)*pnorm(d2)
  }
  if(type=="P"){
    value = K*exp(-r*T)*pnorm(-d2) - S*pnorm(-d1)
  }
  return(value)
}

The Bisection method will try to reduce the err term in the code below
err  = BS(S,K,T,r,sig,type) - market

The function implied.vol will take these inputs and minimise the err term upto 1000 iterations
implied.vol =
  function(S, K, T, r, market, type){
    sig = 0.20
    sig.up = 1
    sig.down = 0.001
    count = 0
    err = BS(S, K, T, r, sig, type) - market 
    
    ## repeat until error is sufficiently small or counter hits 1000
    while(abs(err) > 0.00001 && count<1000 div="">
      if(err < 0){
        sig.down = sig
        sig = (sig.up + sig)/2
      }else{
        sig.up = sig
        sig = (sig.down + sig)/2
      }
      err = BS(S, K, T, r, sig, type) - market
      count = count + 1
    }
    print(c("Counter is ",count),sep='')
    ## return NA if counter hit 1000
    if(count==1000){
      return(NA)
    }else{
      return(sig)
    }
  }

I clocked the execution and took the following AAPL option
Oct 2 Expiry as on 28th September with a Strike Price of 110

startTime = Sys.time()
implied.vol(112.44,110.00,4/252,.0031,3.50,"C")
print(Sys.time() - startTime)

0.02500105 secs 17 iterations

2) NEWTON RAPHSON

Newton-Raphson method (univariate)


We will recalculate the option price using Newton Raphson

NR = function(f,tolerance=.0000001,start=1,iteration=100)
{
  deltax=.0000001
  counter=1
  current=start
  arrayofSolutions=numeric(iteration)
  while(counter <=iteration)
  {
    df.dx=(f(start+deltax) -f(start))/deltax
    current=start - (f(start)/df.dx)
    #print(current)
    arrayofSolutions[counter]=current
    counter = counter + 1
    if(abs(current-start) < tolerance) break
    start=current
  }
  return(arrayofSolutions[1:counter-1])
}

BSVolatility = function(volatility)
{
  BS(112.44,110.00,4/252,.0031,volatility,"C") - 3.5
}

I clocked the timings
startTime = Sys.time()
NR(BSVolatility,.000001,1,100)
print(Sys.time() - startTime)

0.01400089 sec 4 iterations
Sunday, September 27, 2015

Bollinger Bands using R

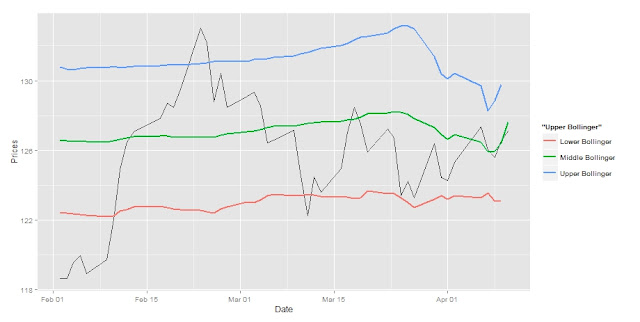
Bollinger Plots are a very good way of providing technical information on plausible Buy or Sell on a particular security. They are based on moving averages and thus are simple to create

However, there are 2 parameters that are inputs to the Bollinger Band
1) The period of days considered for calculating the moving average
Most of the analysts use a 20 day plot, but you can use any period based on the security. e.g. A highly liquid security with high volatility should have a lower period.

The R script can be downloaded here

# Bollinger Bands
Ticker = 'AAPL'
URL = paste(c('http://real-chart.finance.yahoo.com/table.csv?s=',Ticker,'&a=01&b=01&c=2015&d=04&e=10&f=2015&g=d&ignore=.csv'),collapse="")
Prices = read.csv(URL)
Prices = Prices[,c(1,5)]
# Simple moving average of a vector of price and the number of days
getMovingAverage = function(dataVector,periodDays,method){
  dataVectorOutput = dataVector
  lengthofVector = length(dataVector)
  for(start in 1:lengthofVector)
  {
    if(start < periodDays)
    {
      dataVectorOutput[start] = NA
    }
    else
    {
      if(method=="mean")  dataVectorOutput[start] = mean(dataVector[start-periodDays:start])
      else if(method=="sd") dataVectorOutput[start] = sd(dataVector[start-periodDays:start])
    }  
  }
  return(dataVectorOutput)
}

dataVectorOutputMean = getMovingAverage(Prices$Close,20,"mean")
dataVectorOutputSD = getMovingAverage(Prices$Close,20,"sd")
Prices$Middle = dataVectorOutputMean
Prices$Upper = dataVectorOutputMean + dataVectorOutputSD * 2
Prices$Lower = dataVectorOutputMean - dataVectorOutputSD * 2

#Remove all the NULLS
Prices = Prices[!is.na(Prices$Middle),]

# Change the date to something that ggplot will understand
Prices$Date = as.POSIXct(as.character(Prices$Date),"%Y-%m-%d")

# Plot the Bollinger
library(ggplot2)
g = ggplot(Prices,aes(Date,Close,group=1)) + geom_line()
g = g + geom_line(data=Prices,aes(Date,Upper,group="Upper Bollinger",color="Upper Bollinger"),size=1)
g = g + geom_line(data=Prices,aes(Date,Middle,group="Middle Bollinger",color="Middle Bollinger"),size=1)
g = g + geom_line(data=Prices,aes(Date,Lower,group="Lower Bollinger",color="Lower Bollinger"),size=1)
g = g + xlab("Date") + ylab("Prices")
g


A Sample plot for the AAPL Stock was created using the above script

Sunday, September 20, 2015

Curve Fitting

It is wonderful to see how so many things that we learn individually in our mathematics class come together to solve one problem statement

Lets say we have the density of returns of a particular stock. I want to know the mathematical formula that would simulate the graph

In the graph shown above, we have the returns for  AAPL. Now I tried using the Generalized Hyperbolic distribution and fitted it using Maximum Likelihood Estimation. It has done a pretty good job but we want to be more accurate. We will see what else we can do to make it more accurate

Thursday, April 30, 2015

Relation between 2 distributions

Often we must have faced a situation where we wanted to know, how similar is a distribution compared to the other one. Okay, you got me, correlation is an answer, but what if I want to know how similar and far away are the distributions from each other

In my earlier blog post, I was adopting a crude manner. It worked because I needed a rough figure, but if you want statistically backed numbers, there are a lot of methodologies out there

http://en.wikipedia.org/wiki/Bhattacharyya_distance
http://en.wikipedia.org/wiki/Mahalanobis_distance
http://en.wikipedia.org/wiki/Kullback%E2%80%93Leibler_divergence

We will now compare the results for each of the above methods for various series

  • series1 = c(1,2,3,4,5)
    series2 = c(1,2,3,4,5)
Bhattacharya Distance : 0
Mahalanobis Distance : 0
Kullback Liebler Divergence : 0

  • series1 = c(1,2,3,4,5)
    series2 = c(1,2,3,4,10)
Bhattacharya Distance : 0.182661
Mahalanobis Distance : 0.03571429
Kullback Liebler Divergence : 0.444719


  • series1 = c(1,2,3,4,5)
    series2 = c(1,2,3,4,20)
Bhattacharya Distance : 0.7277557
Mahalanobis Distance : 0.25
Kullback Liebler Divergence : 1.201438
  • series1 = c(1,2,3,4,5)
    series2 = c(1,2,3,4,50)
Bhattacharya Distance : 2.305805
Mahalanobis Distance : 1.35
Kullback Liebler Divergence : 2.191514

From the above results we can see that Bhattacharya Distance and Kullback Liebler Divergence is a better measure of the divergence of two series. Their movement does not change very rapidly with one outlier


If we now get on to serious business, comparing stock prices. The stocks that I have chosen are
1) Apple : AAPL
2) Amazon : AMZN

I have considered 2 months of daily trading data


Bhattacharya Distance : 31.17678
Mahalanobis Distance : 31.10953
Kullback Liebler Divergence : 2416.31

Let us take another example with a lot of volatility


Bhattacharya Distance : 6.910062
Mahalanobis Distance : 6.415947
Kullback Liebler Divergence :42.18934

We see that almost all the values have decreased. This is because the two stock prices are closer to each other. WE need to find a way in which we can use the distance values and plug it into the correlation analysis

The code for the various distances is mentioned below

series1 = c(1,2,3,4,5)
series2 = c(1,2,3,4,50)
cov1 = cov(as.matrix(series1))
cov2 = cov(as.matrix(series2))
mean1 = mean(series1)
mean2 = mean(series2)
meanAverage = (mean1+mean2)/2
seriescov = (cov1+cov2) / 2
bhatt = (1/8) * t(as.matrix(mean1-mean2)) %*% solve(as.matrix(meanAverage)) %*% as.matrix(mean1-mean2) + 0.5*log(seriescov/sqrt(cov1*cov2))
mahal = (1/8)*t(as.matrix(mean1-mean2)) %*% solve(as.matrix(meanAverage)) %*% as.matrix(mean1-mean2)
kullback = 0.5 * ( ( matrix.trace(solve(as.matrix(cov2))%*%as.matrix(cov1)) ) + (t(mean2 -mean1) %*% solve(cov2) %*% as.matrix(mean2-mean1) ) - 1 + log(det(as.matrix(cov2))/det(as.matrix(cov1))))


Sunday, April 19, 2015

Coursera Course Distribution

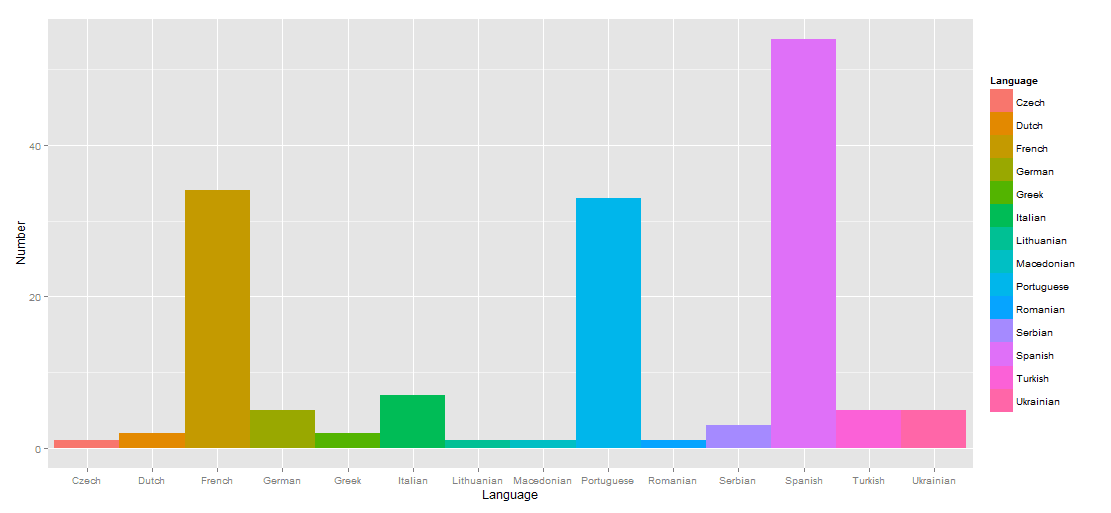
Coursera has revolutionized online education. Like me it has given hope to millions of students worldwide who want to study different subjects. For fun,  I wanted to look at the distribution of languages of the various courses available

  • Distribution by Region ( excluding English Courses )
The file which contains the data is present here


I used R and ggplot to create a pie chart

languages = read.csv("Languages.csv",header=TRUE)
library(sqldf)
continents = sqldf("select Continent,sum(Number) Count from languages group by Continent")
library(ggplot2)
ggplot(continents, aes(x="", y=Count, fill=Continent)) + geom_bar(width = 1, stat = "identity") + coord_polar(theta="y") + ylab("Number of Courses")

  • Distribution of Asian Courses
  •  Distribution of European Courses


R Tips - SQLDF, Lists

R is a wonderful language, and I hope more and more enthusiasts contribute to it. However like me, almost everybody is stuck with small irritating issues.

  • Joining/Filtering tables using SQLDF in R
SQLDF is a very powerful module. It brings the power of SQL to the already statistically powerful R

install.packages("sqldf")
library(sqldf)
crestValues = subset(testdata,Direction=='Crest')  

# Simple Select Query with SQLDF in R
out=sqldf("select Date,Close,JulianDate from crestValues order by JulianDate asc")

#  Inner Join  with SQLDF in R

finaltables11 = sqldf("select out2.lowJDate,out2.highJDate from tables11 inner join out2 where tables11.s2==out2.s2)

# Left Outer Join with SQLDF in R
tempt=sqldf("select t1.Close,max(t2.Close),t1.JulianDate as lowJDate,t2.JulianDate as highJDate from out t1 left outer join out t2 where t2.JulianDate > t1.JulianDate group by t1.Close")


# Fetch First Rows in a SQLDF R Query
tables11 = sqldf("select sum(highJDate-lowJDate),Count,s2 from tables2 group by Count,s2 limit 1")
  
  •   Accessing Data Frames using strings
There might be occassions where we have made a lot of data frames and we would like to access them based on user input/flow logic. Surprisingly this was a difficult task

Suppose we have 5 data frames created  
tables5 = sqldf("select count(s5) as Count,s5,lowJDate,highJDate from out2 group by s5 having count(s5) = 2 order by count(s5) desc")
  tables4 = sqldf("select count(s4) as Count,s4,lowJDate,highJDate from out2 group by s4 having count(s4) = 2 order by count(s4) desc")
  tables3 = sqldf("select count(s3) as Count,s3,lowJDate,highJDate from out2 group by s3 having count(s3) = 2 order by count(s3) desc")
  tables2 = sqldf("select count(s2) as Count,s2,lowJDate,highJDate from out2 group by s2 having count(s2) = 2 order by count(s2) desc")
  tables1 = sqldf("select count(s1) as Count,s1,lowJDate,highJDate from out2 group by s1 having count(s1) = 2 order by count(s1) desc")


Now I want to access each of the data frames in a for loop. The way I did it was

mylist = list(tables1,tables2,tables3,tables4,tables5)
for(k in 5:1)
  {
    remove(tables11,finaltables11)
    #tables11 = sqldf("select sum(highJDate-lowJDate),Count,s1 from tables1 group by Count,s1 limit 1")
    if(nrow(mylist[[k]])==0)
    {
      next;
    }

....
}

Thursday, April 16, 2015

ExoPlanet Analysis : Numerical to Categorical Data in R

After the recent discovery of a possible man made object by amateur outer space researchers, I thought that I should lay some hands on data from Outer space. I made use of the Exoplanet Orbit Database and the Exoplanet Data Explorer at exoplanets.org.

I used 2 variables Density and Gravity. We all know that more the density, more the gravity, so I just wanted to plot it. The problem was that both these columns were numerical values. This makes it difficult to plot. So i had to convert one of the variables to a category variable

I used the sapply function which proved to be very powerful


exoplanets$densityCategory = sapply(exoplanets$DENSITY,function(x) 
if(is.na(x)){'0'}
else if(x<2) {'less than 2'}
else if(x>=2) {'>2'})
We can always add more categories. So after this, it was a matter of plotting the data.

Sunday, April 5, 2015

Finding patterns in the Maxima/Minima Resistance/Support of Stock Prices

I have frequently seen people trying to find a pattern in the highs and lows of a stock. What they search for is a value that defines the upper limit and lower limit of the stock prices for the short term. This banding allows people to have an increased probability of profit making while taking position.This is usually denoted by a straight line drawn manually on the daily stock price chart. Like the one shown below


However this is easier done manually than automatically.

I plan to reproduce this with the help of an R code. I followed the following process

1) Mark all the "Crests" and "Troughs" on the graph
2) Find the "Crests" and "Troughs" with the maximum similar reflection points
3) These undoubtedly become your resistance/support plots
4) However, we need to find out when the resistance/support has changed ( this usually happens due to any micro/macro factor ). But this is the most difficult part
5) We need to find an algorithm for doing this
6) Also the resistance/support lines in many stocks might not be a zero slope line. They might have some gradient. It is difficult to identify them

The above is the plot of AAPL ( Apple Inc ) on NASDAQ. I have been able to Crests/Troughs but it seems the resistance line is going to have a slope. I need to factor this into my code too

After factoring in the slopes for finding the support plots/trends there was significant improvements in the plots. The code can be found here . However the input data required for this consists of daily stock prices. This can be found as a separate R script here
You need to replace the system file paths in the scripts

Some sample graphs from this code are


Some more refinement is required. Any comments or reviews are welcome

Saturday, March 28, 2015

Can we predict Financial Crisis : Equity Correlation

Can we predict any financial crisis? Can we take a look at the stocks at any moment and say whether the market is moving towards another booom. Everybody wants to have such an analysis in their bag.
This will not only help an organization avoid market losses but use that information to their advantage

A financial crisis is preceded by a financial bubble, where speculation reaches its maximum. In other words the stocks become highly correlated. So it does not matter where you are investing. Every stock would have a positive return

1) Multiple Correlation Coefficient
This is the basis of my analysis. On a particular exchange, If i observe the correlation statistics of all stocks and can prove that the correlation is converging then we can raise the flag. However with hundreds of stocks it is difficult to analyse the correlation matrix. So we have to come up with a singular number. So i used the Multiple Correlation Coefficient. You can reach more about it at http://en.wikipedia.org/wiki/Multiple_correlation

Let us assume that we have 100 stock prices. We can make the first stock price as the dependent variable and the rest of the 99 stocks as the independent.
We then calculate the correlation matrix for the 99 stocks which gives as the below matrix R


We then calculate the matrix C which is the correlation between the dependent stock and each of the 99 independent stocks

The Multiple Correlation Coefficient is now simply


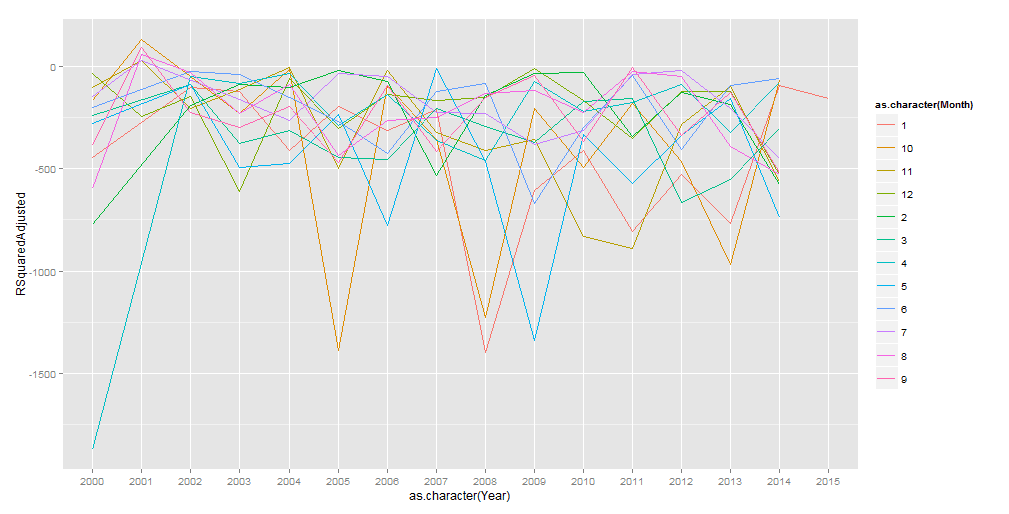
I took BSE(Bombay Stock Exchange) as my initial sample space. I have two graphs


 The values plotted are for the Adjusted Correlation Coefficient from 2000 to 2010

 The values plotted are for the Adjusted Correlation Coefficient from 2000 to 2014

However, the above method can be assumed to be brute force. We would like to intelligibly select the independent variables. I plan to use PCA and Cholesky for further analysis and compare the data

2) Principal Component Analysis


3) Cholesky Transformation

Sunday, March 22, 2015

Historical Finance News Feed

I scraped some financial news data for the year 2015. The file is present here. I am scraping data for the past 15 20 years for all subject lines ( Commodities, FX, Bonds etc )

Scraping the data is not enough. We would like to link the news to some effect on the stock prices so that we can use it for prediction/forecasting.

ANALYSIS 1
I took the stock prices and found the variation between the High and Opening Prices. Any day with a movement of more than 4 SD's can be marked as potential news days. We will then take the news from these days and mark them as having POSITIVE Sentiment on the Stock

Code
# Accessing the news feed content in R
library(XML)
library(RCurl)
# Find the big deviations and find if there are related news and vice versa

# We will read data from the master source file of RICS
Tickers = read.csv('C:\\Anant\\MyLearning\\Statistics\\SpreadAnalysis\\WorldTickerList.csv')

# For now we will take the example of GOOGLE in that list
Tickers = Tickers[Tickers$TICKER=='GOOG',]

# We will use the Ticker value and download data from Yahoo Finance
# You can also customise the date ranges
URL = paste(c('http://real-chart.finance.yahoo.com/table.csv?s=',as.character(Tickers$TICKER),'&a=00&b=01&c=2015&d=08&e=30&f=2015&g=d&ignore=.csv'),collapse="")
GOOG = read.csv(URL)

GOOG$OpenHighSpread = GOOG$High - GOOG$Open
GOOG$LowHighSpread = GOOG$High - GOOG$Low
GOOG$OpenHigh = (GOOG$OpenHighSpread - mean(GOOG$OpenHighSpread))/sd(GOOG$OpenHighSpread)
GOOG$LowHigh = (GOOG$LowHighSpread - mean(GOOG$LowHighSpread))/sd(GOOG$LowHighSpread)

MajorPoints = GOOG[GOOG$OpenHigh < -3 | GOOG$OpenHigh > 3,]

# We see that there were 4 dates when there was a lot of deviation in the Open High
# There must have been some news around these dates

#############################################################################################
# Source 1 : GOOGLE

#############################################################################################
# source 2 Reuters
for(dateValue in MajorPoints$Date)
{
  newsDateURL = paste(c('http://www.reuters.com/finance/stocks/companyNews?symbol=GOOG.O&date=',format(as.Date(dateValue,"%Y-%m-%d"),"%m%d%Y")),collapse="")
  #newsDateURL = paste(c(newsURL,'&startdate=',dateValue,'&enddate=',dateValue),collapse="")
  print(newsDateURL)
  doc = getURL(newsDateURL)
  doc = htmlParse(doc)
  news = xpathSApply(doc,'//div[@id = "companyNews"]/div/div/div/p')
}

#############################################################################################
# Source 3 Google
for(dateValue in MajorPoints$Date)
{
  newsDateURL = paste(c('http://finance.yahoo.com/q/h?s=',as.character(Tickers$TICKER),'&t',as.character(dateValue)),collapse="")
  #newsDateURL = paste(c(newsURL,'&startdate=',dateValue,'&enddate=',dateValue),collapse="")
  print(newsDateURL)
  doc = getURL(newsDateURL)
  doc = htmlParse(doc)
  news = xpathSApply(doc,'//div[@class = "mod yfi_quote_headline withsky"]/ul/li//a')
}


Next step is to do some Language Processing on this data

Thursday, March 19, 2015

Finding monthly Patterns in Stocks

There are some stocks that perform well at a certain time of the year due to the nature of the business. I tried to isolate those stocks. I took BSE as my base and got data for the past 12 years

The graph below is for VOLTAS.BO ( Sum of Returns for the entire month vs Month ) across 12 years

The code for obtaining the above graph can be found here

I then took other exchanges around the world to find patterns in stock prices. I calculated the standard deviation of the monthly returns for each month across the years. The stocks with the lowest standard deviations were the ones which saw equal increase or decrease in returns during that month across years. The code for doing it can be found here

Within the code you can replace the line
dataFile <- br="" nant="" orldtickerlist.csv="" read.csv="" tatistics="" tockdata="" ylearning="">
with your own ticker list. I have a reference to the world ticker list present in my earlier blog post
http://simplyanant.blogspot.in/2015/03/download-all-tickers-for.html

 For BSE I got the following results. You can use the commented ggplot command in the code to plot the graph and see for yourself. There will be a month where the returns follow a pattern
[1] "TURBO.BO"
[1] "KEDIAVA.BO"
[1] "JRIIIL.BO"
[1] "JPPOWER4.BO"
[1] "JOLLYRID.BO"
[1] "JUMBFNL.BO"
[1] "TURBO.BO"
[1] "KEDIAVA.BO"
[1] "JAGSONFI.BO"
[1] "JRIIIL.BO"
[1] "JPPOWER4.BO"
[1] "JOLLYRID.BO"
[1] "JUMBFNL.BO"
[1] "RAJOIL.BO"

Best of luck hunting stock patterns :) Any suggestions are welcome

Obviously the following will give you a hint :)


Tuesday, March 17, 2015

Mumbai Weather Analysis

After staying in mumbai for the past 4.5 years, I have come to the conclusion that the weather is not quite what I had expected. I had expected a moderate one with lots of wind, but sadly that is not the case. It might be because of the high rise construction or the traffic, but who knows

I collected data available for a mumbai weather station. The data is available in form of an excel sheet here

Let us start with max temperature

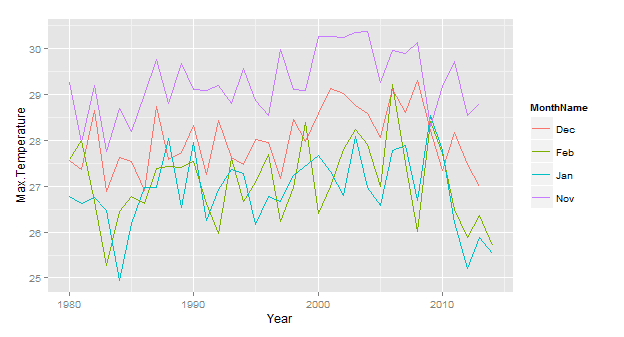
In the summer season, the max temperature has actually decreased from 2010 onwards. It rose to its maximum in the month of May

We can see that the month of November considered everywhere else as a winter month is not so, for the month of November

October sees a sharp rise in temperature as the monsoon recedes


Let us come now to Minimum temperatures

Surprisingly, there is a huge shift between the temperatures of March and April ( the onset of summer )
Rain keeps the climate moderate with less differences between the max and min temperatures which can be seen here

There is again a huge difference between the min temperature for the month of Nov and that of Dec

Monday, March 9, 2015

Download all tickers for Stocks,ETF,Mutual Fund etc from all over the world

Sadly there is no easy way to download all the ticker information. The only way I could do it is to parse the Yahoo finance web pages and parse them

Dowload the file 

The above file has the timestamp of 15th March. I used PErl to scrape the web pages. If somebody wants the Perl code to obtain this information, just let me know. It is pretty simple, although it will take 5 to 6 hours

Sunday, March 8, 2015

Pulling Stock Data through R/YQL

After i got the list of all tickers of products around the world, I started pulling data and doing some analysis. The easiest of the analysis were
1) Finding the spread
2) Finding the correlated products

I chose stocks from 2 countries
a) BSE Stocks from India
b) German Stocks from the DE Bourse
c) Currency data all over the world

Here are a few interesting points
From the analysis from the year 2013 onwards, the currencies CAD and GTQ had the highest negative correlation. In order to verify it, I pulled data from the website and it matches

On the flip side, the highly correlated currencies were DKK and XAF


One more observation is that most of the OPEC countries have their currency highly correlated to the dollar trying to find a correlation between them and other currencies s similar to finding correlations between USD and other currencies

The R script which i used to find out these is located here and here. The first file is to calculate the spread/deviation and the second is to download the data. The scripts are pretty simple, one needs to change the directories though for their use

If you want to use excel to extract the stock information, then the best method would be YQL .It is easy to use and you have all sorts of information in  a structured format

If you want to pull out historical prices with the following specifciations
Symbol/Ticker : symbol
StartDate
EndDate

then the correpsonding weblink to extract this info would be ( the below is in excel vba format )
"http://query.yahooapis.com/v1/public/yql?q=select%20*%20from%20yahoo.finance.historicaldata%20where%20symbol%20in%20%28%27 " & symbol & "%27%29%20and%20startDate%20=%20%27" & startDate & "%27%20and%20endDate%20=%20%27" & endDate & "%27&diagnostics=true&env=store://datatables.org/alltableswithkeys"

I have created an excel sheet where you can give a list of the stock tickers and the start and end date and it will download the neccessary information within the excel sheet

You can download the sheet here and tweak it as per your requirements. Enjoy

Wednesday, February 25, 2015

Cutting of Trees at Aarey Milk Colony, Mumbai

The recent decision by MMRDA to cut down 3000 trees in the Aarey Colony is a bad one. It seems they have little idea of the importance of the aarey forest land around Mumbai

With a population of 20000000 Mumbai emits around 3 crore tons of carbon per year. Most of it is thrown into the atmosphere. A large part is sequestered by the Sanjay Gandhi National Park. However it is one trees work at a time.

Due to the 3000 trees being cut , 52 tons of carbon will be emitted into the atmosphere. And on an annual basis a 100 tons of carbon which would have been sequestered will now remain in the atmoshphere


Monday, January 12, 2015

Movie Stats .. Bollywood

Hi, I have been recently thinking of an area to analyse and after watching some bad movies, I decided to give a go for bollywood movies. Can we crunch it through numbers/stats to fin out whether the movie will do good or bad ( irrespective of what the movie is about). This project is comprehensive and it will take time to collect data, so i will go slowly

I took the 2001-2010 decade and tried to analyse the move gross by months. We see that that the month of Dec did not hold a lot of promise. It was obviously pre-Aamir Khan era. From 2007 there has been a surge in the gross collected in the month of December. A jump of almost 150% to 100 crore rupees


In the above images we can see a lot of shifts

1) Increase in movie gross Revenue ( in crores )

2) Change in the monthly Gross Revenue ( in crores )

It can be easily seen that purely on the basis of Month, we will not be able to ascertain the earnings. E.g. In the era 2002 to 2009, there were few months that would steal away most of the revenues. In 2007-2008 alone Aug, Oct and Dec stole away 50% of the yearly gross. In 2013 the top 3 months have taken away 38% of the revenue. The figure was even less in the years 2012 and 2011. Movies have begun to spread out evenly and there are more opportunities for newcomers and new genres

On running a simple linear regression between the
a) Earnings of Dec : Dependant Variable
b) Earnings of Aug, Sep, Oct, Nov : Independant Variables


  Coefficients
Intercept 11.28481646
Aug 0.281777793
Sep 0.280503546
Oct -0.094513125
Nov -0.419597559

It is inversely related to the month of November ( highly inverse )

There are more factors at play
1) Director/Producer
2) Actor
3) Festival
4) etc.. etc

I will be taking all of these into consideration in my next article. Please let me know if you have some other suggestions/ideas

Thursday, January 8, 2015

Pulling Company Information through R


For some time now, I was grappling  with getting company fundamental ratios to be able to do analysis. I have written a small R script that downloads the necessary market data for that stock ( in the example AAPL ). The source of the data is YAHOO Finance

After execution the R workspace will contain 2 data frames
ratios    -> Quantitative Data
ratios2  -> Qualitative Data

Download File


I am working on getting more balance sheet related information. It is always better to have more information while doing analysis

If anybody wants to have the complete list of companies enlisted in NSE, you can get it here Download File

After searching around for some time, I wrote a script that will scrape and list the tickers etc for products around the world. The current list contains of 110,000 products. You can download the Excel file here Download File Timestamp : 2nd March,2015 ( I refrained from using csv, because the company name consisted of all sorts of characters which can meddle with string separation :) )